The Fleet Monitoring Dashboard from MarineTraffic, which was created with ship managers, owners, and brokers in mind, is a tool that converts complicated data into easy-to-understand charts that provide key fleet insights about fleet management, always based on maritime intelligence.
Ship managers around the world are responsible for monitoring their fleet performance 24/7/365. Anywhere their ships are sailing, at any moment, they need to be fully aware of what is going on at sea. This is a priority so they can schedule voyages ahead, create smart and cost-efficient plans as well as build reports of performance when a ship has reached its destination; for every single asset they are responsible for.
Can you imagine how hectic a business schedule can be if the size of the fleet is a 2- or a 3-digit number?
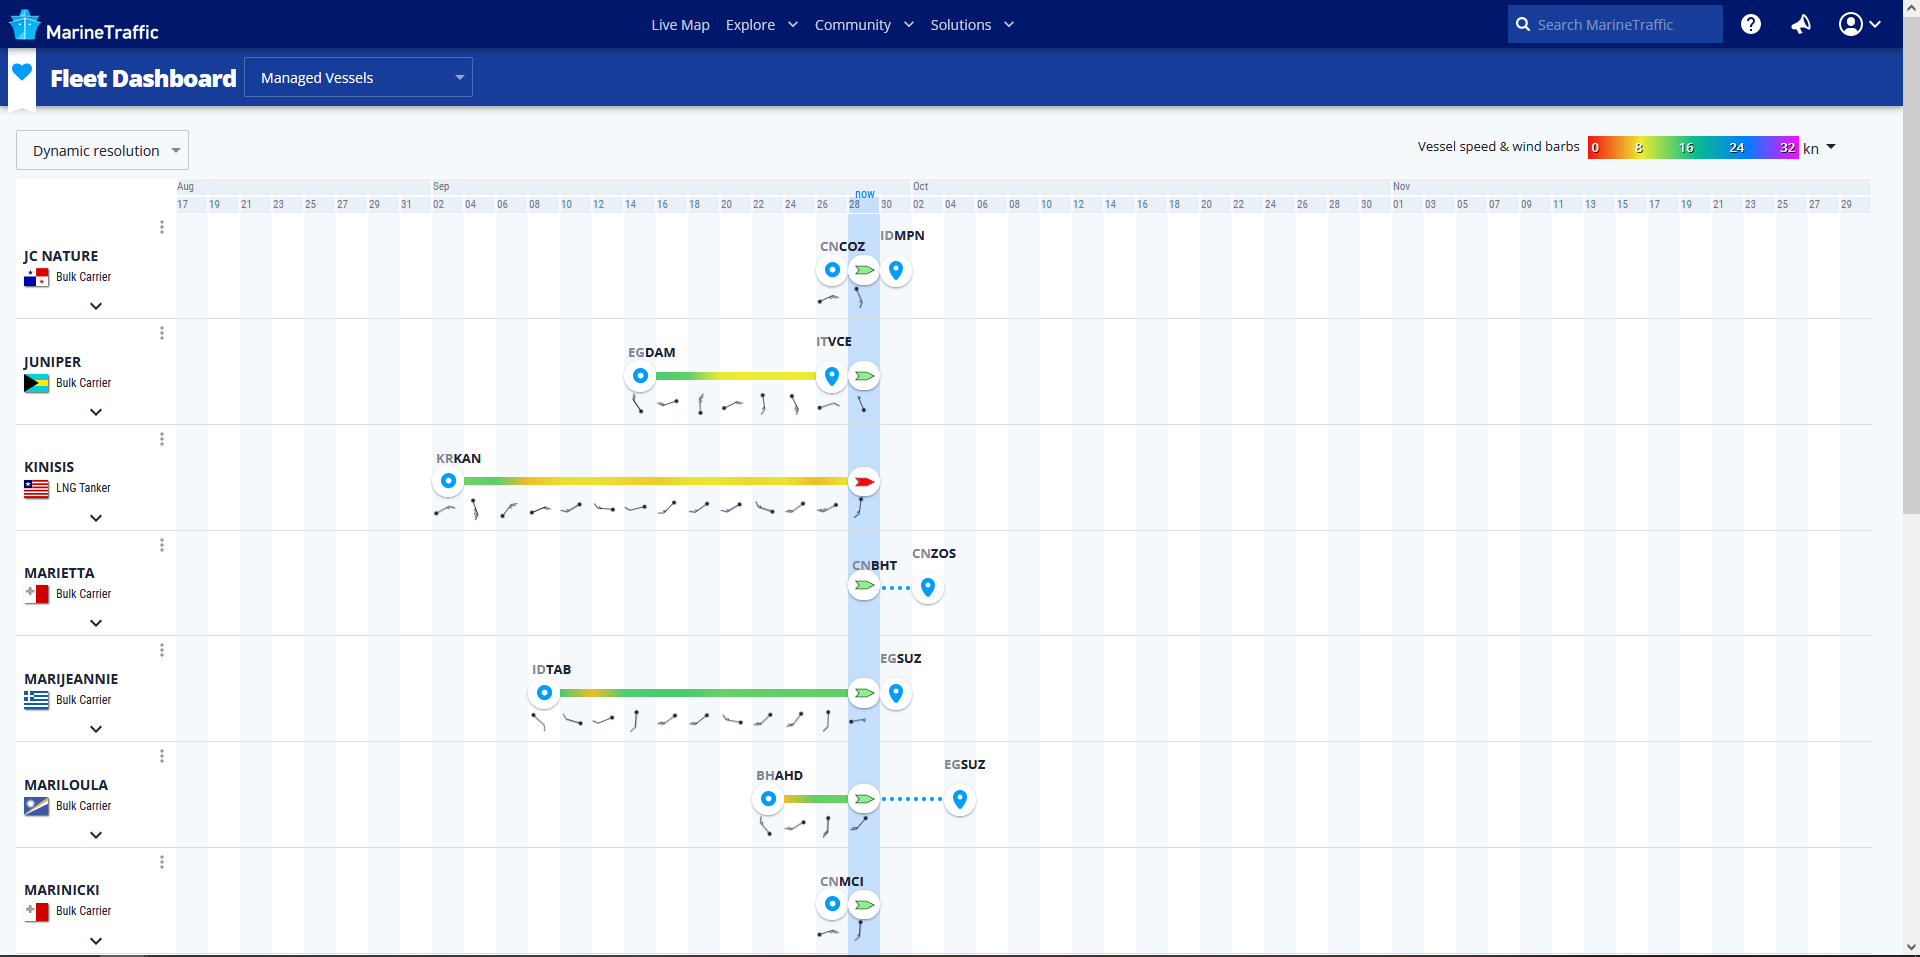
Our Fleet Monitoring Dashboard, offered through our Fleet Management Solution, is a single screen of a dynamic timeline, appearing at a click of a button, that provides an overview of the data you need to help you analyse your fleet performance at a glance, no matter how small or large that is.
Every fleet you created on MarineTraffic, is a fleet you can monitor through the dashboard.
Based on the rich knowledge and even richer data availability we own, this user-focused dashboard equips you with all you need to stay abreast of what matters to your business when it comes to fleet monitoring, such as:
-
- the origin and destination port of each vessel,
- the last position timestamp of each vessel,
- past track voyage combined with weather conditions
- the speed of each vessel
- key weather data against the present time
- ETA to destination
at a 1/3/6/12/24-hour or dynamic resolution. This truly insightful dashboard provides you with an up-to-date overview of all current fleet voyages. This includes pertinent information like how/when/where each voyage started, how it is progressing, and calculated estimation for its future development; In a nutshell, a bird’s eye view of your fleet operations.

Key info included in the Fleet Monitoring Dashboard
It would be easier for us to list what is not included here, but let’s give it a try 🙂
Apart from the apparent info included in the table seen above, you also access vital information about the vessel (name/ flag/ type), the voyage (all the timeline) in regards to the weather such as:

but also information about the origin and the destination port, as in the example that follows.

If your focus is the arrivals at a specific port, this tool comes in handy. First, you may use the MarineTraffic Exploration tool, filter results by choosing the ‘Expected arrivals’ to the port you are interested in keeping a close eye on, then create a fleet with all the vessels that have reported the port as their destination, and thanks to the Fleet Monitoring Dashboard view, you can now see how these particular ships of interest are competing against the ETA to the destination selected.
Benefits the Fleet Monitoring Dashboard offers
- Overview of every vessel voyage status
- Easier comparison of vessel performance (if for instance, a specific port is what you are interested in, as mentioned above)
- Faster detection of potential issues (and faster, more-informed response if needed. Know for instance when there is a change of ETA or when a ship slows down against good weather, etc.)
- Smoother collaboration for teams online (by sharing the fleets with your team members, you avoid misunderstandings and ensure that everyone is on the same page)
The Fleet Monitoring Dashboard from MarineTraffic is the ideal tool for tracking your desired fleet performance. It is actually the main command center where ship managers or ship owners can monitor their assets in real-time, ensuring that they stay on top and improve operational efficiency.
Ready to add this to your technology toolbelt?
