This blog post was updated on 10/6/2019
When producing statistical data, few things are more important than precision. At MarineTraffic devising the most precise method to define port and anchorage boundaries continues to be an important challenge. Here we discuss the journey over the past ten years and how MarineTraffic is now redefining how ports and anchorages can be mapped to provide vital insights for the maritime industry.
Past to present
When MarineTraffic first imported ports/anchorages as points on a map just over ten years ago, it was clear that some greater detail would be necessary to turn this information into something useful. A port is not just a dot on a map, but a series of terminals and anchorages. But how do you define a port on the MarineTraffic system? To solve this, we began measuring port limits. A port limit was defined by a square or rectangle known as a bounding box, which walled around the centre of a given port area. This first, but important step, enabled MarineTraffic to monitor port traffic by capturing vessel arrivals and departures through the box area.
The limitation of this approach is that ports are rarely a perfect shape or geometry. In 2014, we began using shapes tailored specifically to any given port’s boundaries, otherwise known as polygons, to gain a more accurate impression of a port’s limits. We then looked to enhance this method by using nautical charts to anticipate possible port restrictions or traffic separation zones. However, as these ports were monitored, observations made around stationary boats outside the port area led to the mapping out of the ports’ complimentary anchorage areas. As a result, in addition to defining anchorage areas on the map, other features such as canals, offshore terminals, shipyards and demolition yards were also added.
Over the last year, MarineTraffic has been focusing on detailing more granular information, such as breaking down port geometries into specified terminals and berths, helping users understand traffic within port boundaries as well as improving efficiency in port.
As ports continue to develop and expand, MarineTraffic data is revised accordingly. We make sure that we stay up to date by not only using official port documents, but also engaging with user suggestions. MarineTraffic internally verifies this information to ensure accuracy.
Drawing the right picture – Geofencing
What sets MarineTraffic apart from competitors is its innovative use of technology to create a virtual geographic boundary. This method, known as ‘geofencing’, enables software to trigger a response when a mobile device (AIS transceiver) enters or leaves a particular area: in this scenario a port/anchorage, in near real-time.
Whereas many providers simply use a circular radius around the centre of a port/anchorage area, when measuring activity, the more tailored approach employed by MarineTraffic of polygonal drawing offers a more specific and valuable picture. While our methodology is more advanced compared to the industry standard, we continue to innovate. At present, MarineTraffic is developing a solution that will allow the manual process of adjusting polygonal boundaries to become more intuitive through automation.
Industry utilisation of MarineTraffic methodology
The United Nations Conference on Trade and Development (UNCTAD) employs MarineTraffic port call data for its ‘Review of Maritime Transport’, an annual report which provides analysis of structural and cyclical changes affecting seaborne trade, ports and shipping. UNCTAD chose to use MarineTraffic due to our expert ability to monitor port calls and widespread coverage of global AIS transmitters.
Many other leading organisations involved directly or indirectly with the maritime ecosystem have been utilising the MarineTraffic expertise to get valuable insights about trends around the ports of the world, make informed decisions to plan their next move or use it as an alternative data source to come up with novel reports and detailed analyses. While here we have shown how MarineTraffic can offer strong commercial benefits, it is important to note that these services are not exclusive to large organisations; all of our users are entitled to them.
MarineTraffic polygons in practice
Below are some visual examples of MarineTraffic polygons in practice. The first is an isolated instance from Port of Cartagena, Spain. The second and third are two cases where numerous port/anchorages are adjacent to one another in the Ise Bay, Japan and the inner gulf of Sikka, India.
Port of Cartagena, Spain
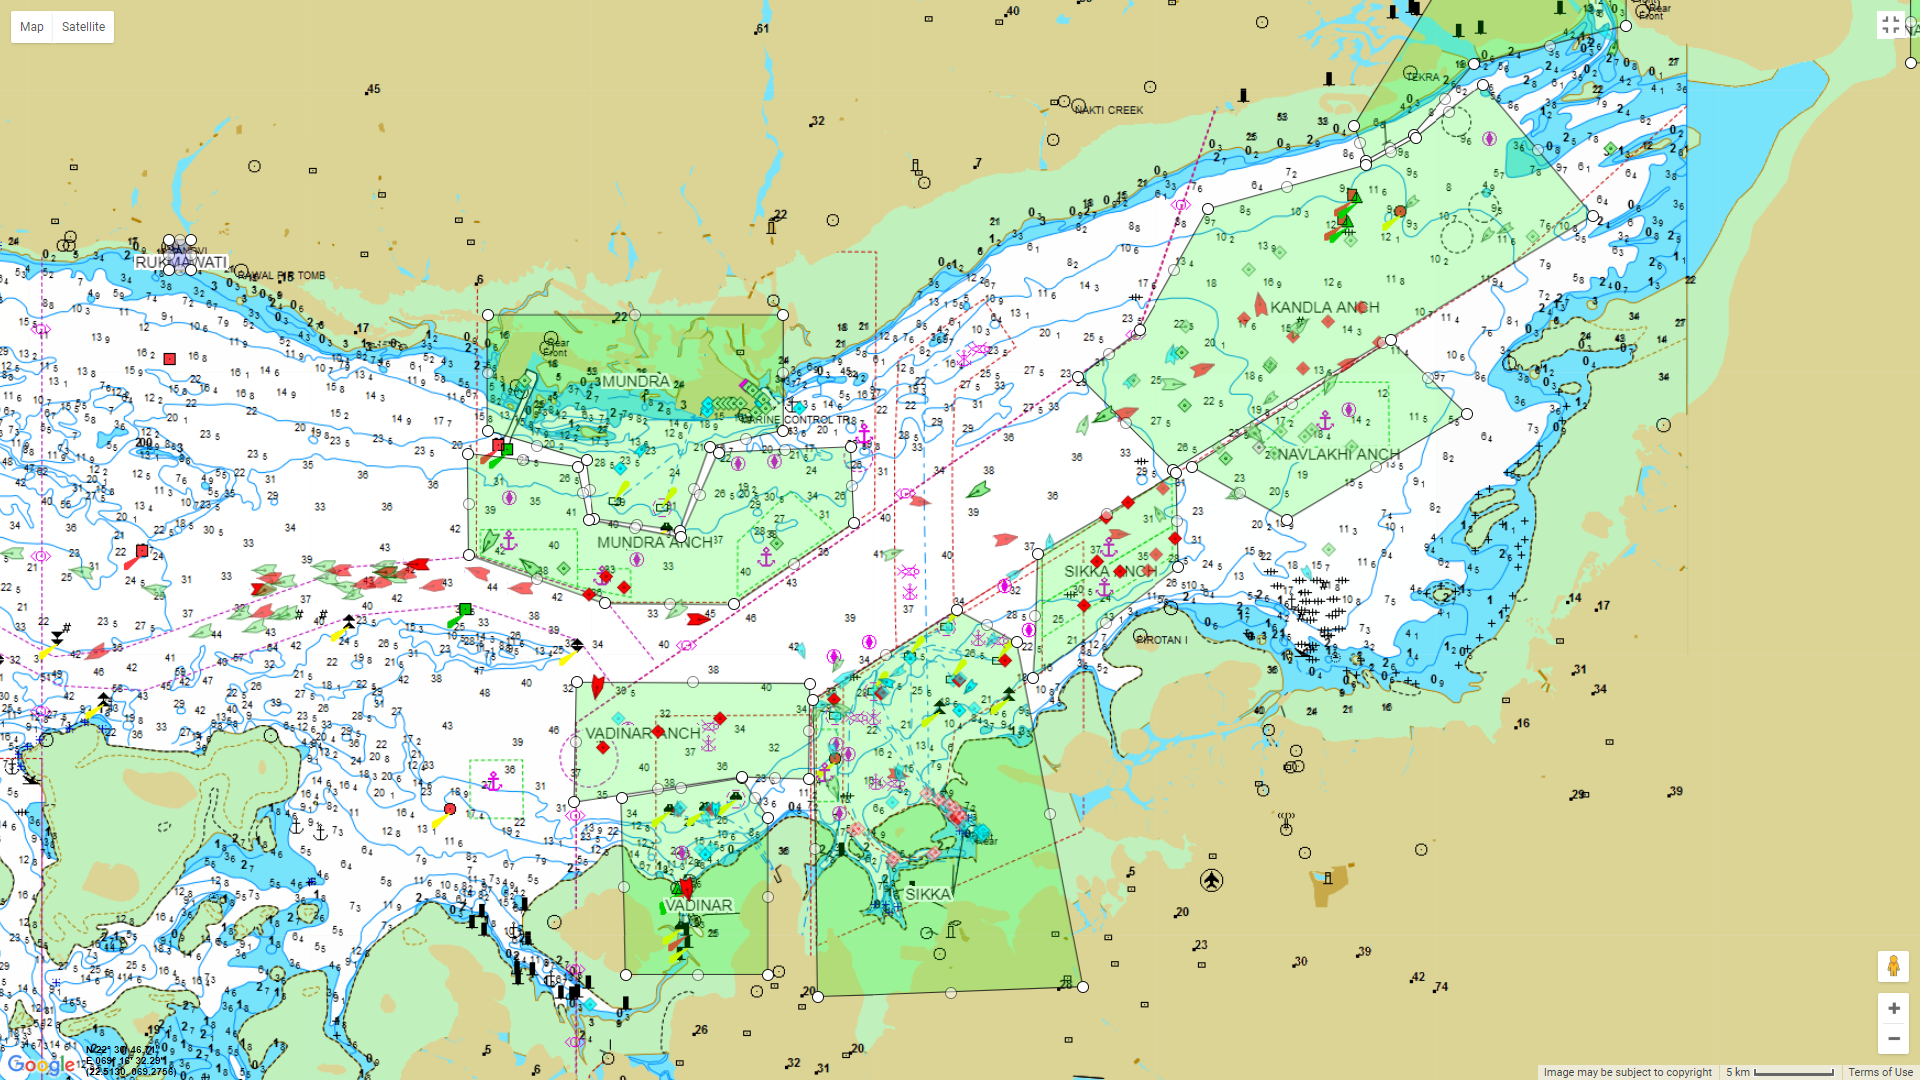
The below snapshot of the Port of Cartagena, Spain is a useful example of a port’s polygon and the polygon of its respective port/anchorage.
Ise Bay, Japan and inner gulf of Sikka, India
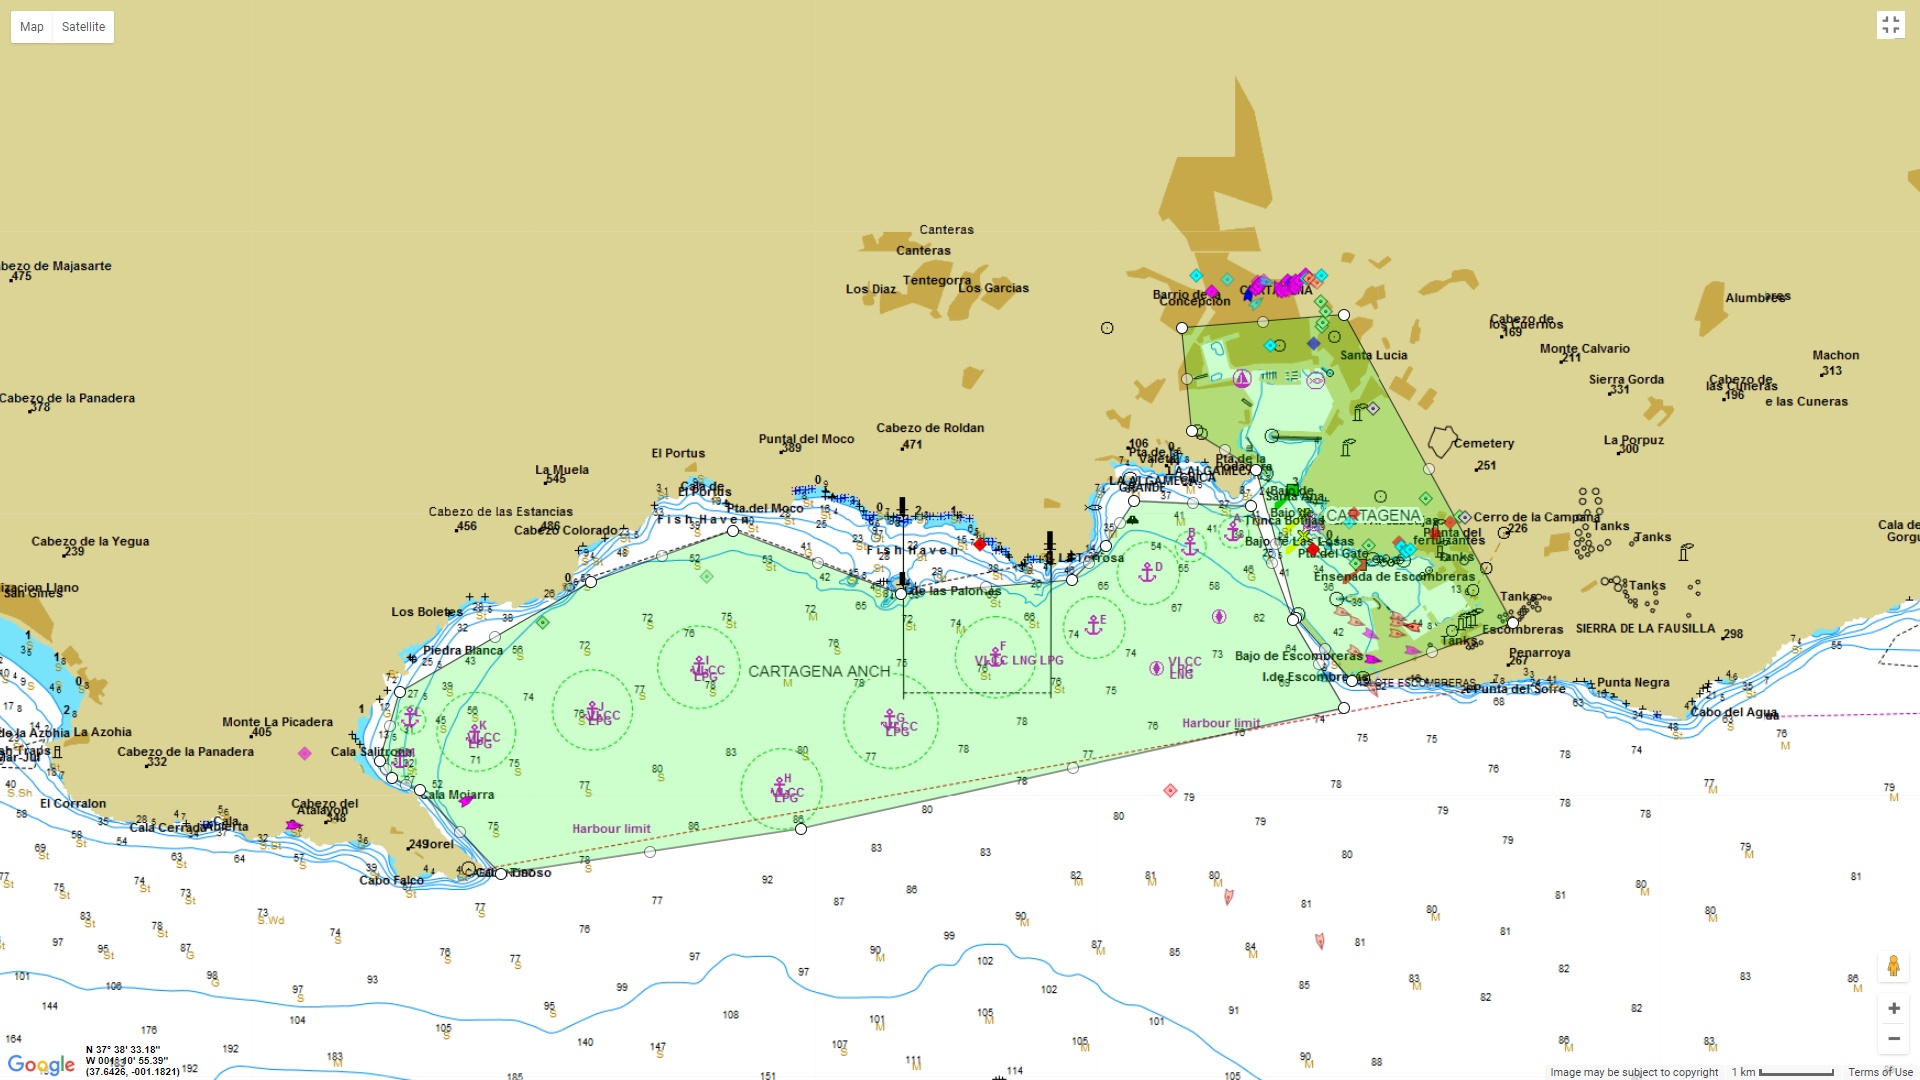
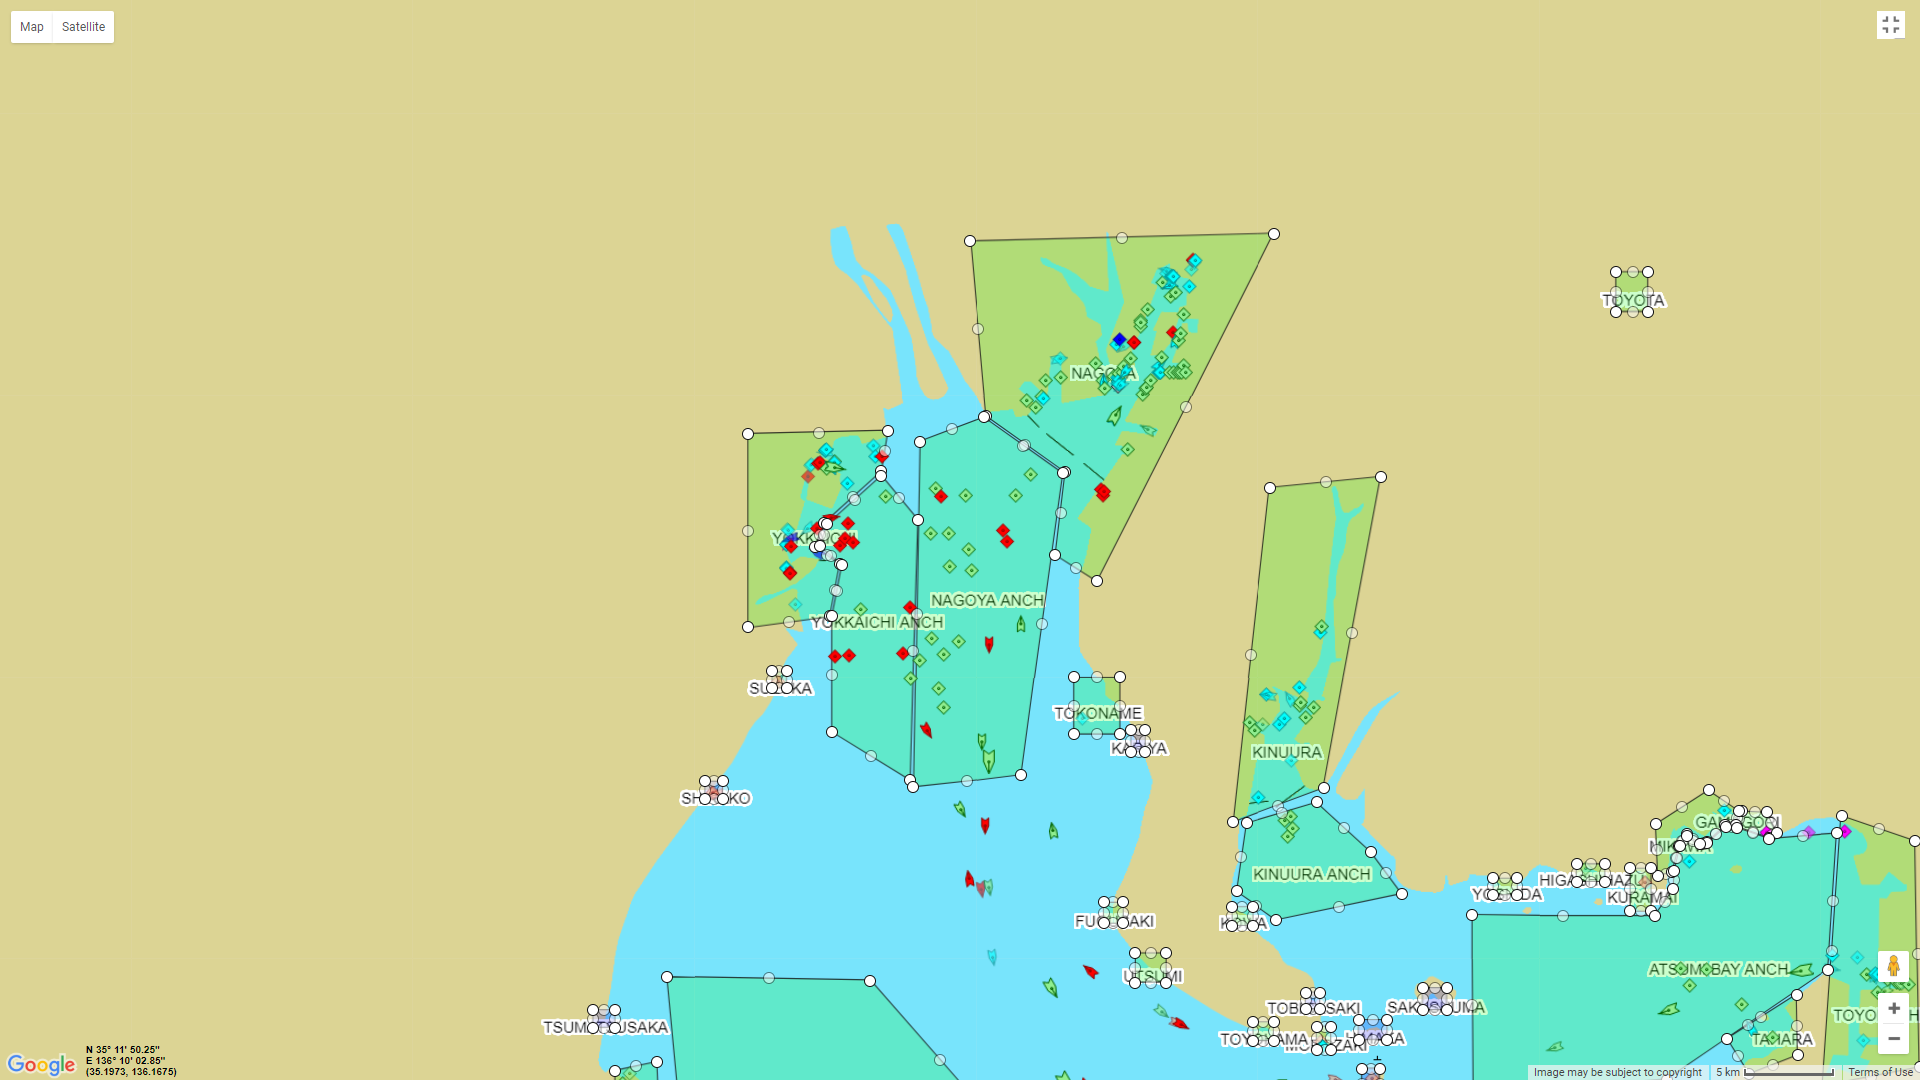
The examples of the Ise Bay, Japan and the inner gulf of Sikka, India, shown below, demonstrate the benefit of polygons to isolate different anchorages in closely distanced ports.
From these examples, it is useful to observe two things when differentiating between a number of adjacent anchorages/ports. First, the availability of charted information regarding the vessel’s point of destination, and second, the actual port of call. By appreciating in retrospect where the particular vessel docks, MarineTraffic can determine the boundaries of the specific port/anchorage in cases where the port/anchorage borders closely with another adjacent port/anchorage.
The specific case of the inner Ise Bay, Japan, demonstrates how MarineTraffic can achieve geofencing even in areas that have not been fully charted by the relevant map service providers (notice the water depth contour lines that are missing from this area, as opposed to the examples of Sikka and Cartagena).
Entering ‘uncharted’ territory – dynamic monitoring
From importing ports as points, through to polygons and geofencing, the MarineTraffic Team has come a long way in the past ten years. Now the Data Team is looking to move into ‘uncharted’ territory by developing a more dynamic monitoring system.
Dynamic monitoring examines areas where clusters of vessels are stationary despite there being no previously known geometry to the system such as a port or an anchorage. If a commercial vessel stops, it does so for a reason, but MarineTraffic is also aiming to discover why. By geofencing areas where clusters of vessels have stopped, finding out the answer becomes simpler.
With all this information in place, MarineTraffic is pushing further by aggregating the relevant data sources to produce additional insights and action reports on anchorage waiting times and port congestion, time in berth/port and idle time. This is allowing MarineTraffic developing this data to display vessel utilisation rates. By achieving this, MarineTraffic hopes to offer added-value intelligence for its users and the wider maritime industry that benefit from our insights every day.
By adding a third satellite provider, MarineTraffic has improved the coverage and allows users to monitor a vessel’s movements more accurately, making it easier for people to best understand when their shipment will be arriving.